

Mercury From Dental Amalgam: Exposure and Risk Assessment
Dental amalgam has been used to restore teeth for nearly two hundred years, and doubts about the apparent contradiction of providing a health care service with a material that contains mercury have persisted the whole time. There has always been an undercurrent within the dental profession of anti-amalgam sentiment, a “mercury-free” movement. While expressions of that sentiment have grown in recent years as it becomes easier to accomplish good restorative dentistry with composites, the general attitude of dentists toward amalgam may be summarized as “there’s nothing wrong with it scientifically, we just aren’t using it so much anymore.”
To ask whether anything is or is not scientifically wrong with amalgam, one must look to the vast literature on exposure, toxicology and risk assessment of mercury. Most of it lies outside the sources of information dentists are commonly exposed to. Even much of the literature on mercury exposure from amalgam exists outside of dental journals. An examination of this extended literature can shed some light on the assumptions that dentistry has made about amalgam safety, and can help explain why some dentists have persistently objected to the use of amalgam in restorative dentistry.
No one now disputes that dental amalgam releases metallic mercury into its environment at some rate, and it will be interesting to briefly summarize some of the evidence for that exposure. The toxicology of mercury is too broad a subject for a short article, and is thoroughly reviewed elsewhere. The subject of risk assessment, however, goes straight to the heart of the debate over whether amalgam is safe, or not, for unrestricted use in the population at large.
What Kind of Metal is in Dental Amalgam?
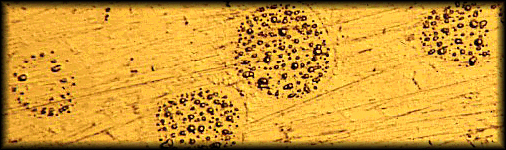
Because it is a cold mixture, amalgam cannot meet the definition of an alloy, which must be a mixture of metals formed in a molten state. Nor can it meet the definition of an ionic compound like salt, which must have an exchange of electrons resulting in a lattice of charged ions. It best meets the definition of an inter-metallic colloid, or solid emulsion, in which the matrix material is not completely reacted, and is recoverable. Figure 1 shows a micrograph of a polished metallurgical sample of dental amalgam which had been impressed by a microscopic probe. At each point of pressure, droplets of liquid mercury are squeezed out. 1
Haley (2007)2 measured in-vitro release of mercury from single-spill samples of Tytin®, Dispersalloy®, and Valiant®, each with a surface area of 1 cm2. After ninety days storage to allow the initial setting reactions to be complete, the samples were placed in distilled water at room temperature, 23˚C, and not agitated. The distilled water was changed and analyzed daily for 25 days, using a Nippon Direct Mercury Analyzer. Mercury was released under these conditions at a rate of 4.5-22 micrograms daily, per square centimeter. Chew (1991)3 reported that mercury dissolved from amalgam into distilled water at 37˚C at a rate of up to 43 micrograms per day, while Gross and Harrison (1989)4 reported 37.5 micrograms per day in Ringer’s solution.
Distribution of Dental Mercury Around the Body
Numerous studies, including autopsy studies, have shown higher levels of mercury in the tissues of humans with amalgam fillings, as opposed to those who were not similarly exposed. Increasing amalgam load is associated with increasing mercury concentration in exhaled air; saliva; blood; feces; urine; various tissues including liver, kidney, pituitary gland, brain, etc.; amniotic fluid, cord blood, placenta and fetal tissues; colostrum and breast milk.5
The most graphic, classic experiments showing in-vivo distribution of mercury from amalgam fillings were the infamous “sheep and monkey studies” of Hahn, et. al. (1989 and 1990).6,7 A pregnant sheep was given twelve occlusal amalgam fillings that were tagged with radioactive 203Hg, an element that does not exist in nature, and has a half life of 46 days. The fillings were carved out of occlusion, and the animal’s mouth was kept packed and rinsed to prevent swallowing of excess material during the operation. After thirty days, it was sacrificed. Radioactive mercury was concentrated in the liver, kidneys, digestive tract and jawbones, but every tissue, including the fetal tissues, received measurable exposure. The autoradiogram of the whole animal, after the teeth were removed, is shown in figure 2.

The sheep experiment was criticized for using an animal that ate and chewed in a way that is fundamentally different from humans, so the group repeated the experiment using a monkey, with the same results.
25 Skare I, Engqvist A. Human exposure to mercury and silver released from dental amalgam restorations. Arch Environ Health 1994;49(5):384–94.
The Role of Risk Assessment
Evidence of exposure is one thing, but if “the dose makes the poison,” as we’ve heard so often in regard to mercury exposure from dental amalgam, a determination of what level of exposure is poisonous and for whom is the province of risk assessment. Risk assessment is a set of formal procedures that use data available in the scientific literature, to propose levels of exposure that may be acceptable under given circumstances, to authorities responsible for risk management. It’s a process commonly used in engineering, as, for example, the public works department needs to know the probability of a bridge failing under load before setting a weight limit on it.
There are a number of agencies responsible for regulating human exposure to toxic substances, FDA, EPA, and OSHA, among them. They all rely on risk assessment procedures to set acceptable residue limits for chemicals, including mercury, in fish and other foods we eat, the water we drink and in the air we breathe. These agencies then set legally enforceable limits on human exposures that are expressed by a variety of names, such as regulatory exposure limit (REL), reference dose (RfD), reference concentration (RfC), tolerable daily limit (TDL), etc., all of which mean the same thing: how much exposure to allow under the conditions the agency is responsible for. This allowable level must be one at which there is an expectation of no negative health outcomes within the population covered under the regulation.
Establishing RELs
In order to apply risk assessment methods for possible mercury toxicity from dental amalgam, we have to determine the dose of mercury that people are exposed to from their fillings, and compare that to established safety standards for that type of exposure. The toxicology of mercury recognizes that its effects on the body depend greatly on the chemical species involved, and the route of exposure. Nearly all the work on amalgam toxicity assumes that the major toxic species involved is metallic mercury vapor (Hg˚) that is emitted by the fillings, inhaled into the lungs and absorbed at a rate of 80%. Other species and routes are known to be involved, including metallic mercury dissolved in saliva, abraded particles and corrosion products that are swallowed, or methyl mercury produced from Hg˚ by intestinal bacteria. Even more exotic pathways have been identified, such as absorption of Hg˚ into the brain through the olfactory epithelium, or retrograde axonal transport of mercury from the jawbones into the brain. These exposures are either of unknown quantity, or are assumed to be of much lesser magnitude than oral inhalation, so the great bulk of research on amalgam mercury has concentrated there.
The central nervous system is presumed to be the most sensitive target organ for mercury vapor exposure. Well established toxic effects on the kidneys and lungs are thought to have higher exposure thresholds. Effects due to hypersensitivity, autoimmunity and other allergic type mechanisms can’t be accounted for by dose-response models, (which begs the question, how rare is allergy to mercury, really?) Therefore, researchers and agencies seeking to establish RELs for low level chronic Hg˚ exposure have looked at various measures of CNS effects. A few key studies (summarized in table 1) have been published over the years that connect the quantity of mercury vapor exposure with measurable signs of CNS dysfunction. These are the studies that risk assessment scientists have relied on.
————————————————————————————————————————————————————————

Table 1. Key studies that have been used to calculate reference concentrations for metallic mercury vapor, expressed as micrograms per cubic meter of air. An asterix* denotes air concentrations that have been derived by converting blood or urine values to an air equivalent according to conversion factors from Roels et al(1987).
————————————————————————————————————————————————————————-
The practice of risk assessment recognizes that exposure and effect data collected for adult, overwhelmingly male, workers in occupational settings cannot be used in their raw form as indicating safe levels for everyone. There are many types of uncertainty in the data:
- LOAEL vs. NOAEL. None of the exposure data gathered in the key studies has been reported in a manner that displays a clear dose-response curve for the CNS effects measured. As such, they do not show a definite threshold dose for onset of the effects. In other words, there is no determination of a “No-Observed-Adverse-Effect-Level” (NOAEL). The studies each do point to a “Lowest-Observed-Adverse-Effect-Level” (LOAEL), which is not considered as definitive.
- Human variability. There are many more sensitive groups of people in the general population: infants and children with more sensitive developing nervous systems and lower body weight; people with medical compromises; people with genetically determined increased sensitivity; women of childbearing age and other gender related differences; elderly, to name a few. Interpersonal differences that are not accounted for in the data make for uncertainty.
- Reproductive and developmental data. Some agencies, such as the California EPA, place more emphasis on reproductive and developmental data, and plug an additional level of uncertainty into their calculations when it is lacking.
- Inter-species data. Converting animal research data to the human experience is never straightforward, but consideration of this factor does not apply in this instance, since the key studies cited here all involved human subjects.
Published RELs for chronic mercury vapor exposure in the general population are summarized in Table 2. RELs meant to regulate exposure for the whole population are calculated to assure that there can be no reasonable expectation of adverse health effects for anyone, so allowable exposures are reduced from the observed lowest effect levels by arithmetic “uncertainty factors” (UF). Uncertainty factors are not decided by hard and fast rules, but by policy – how cautious the regulatory agency wants to be, and how confident they are in the data.
In the case of the US EPA, for example, the effect level (9 µg-Hg/cubic meter air) is reduced by a factor of 3 due to reliance on a LOAEL, and by a factor of 10 to account for human variability, for a total UF of 30. This results in an allowable limit of 0.3 µg-Hg/cubic meter air. 8
The California EPA added an additional UF of 10 for lack of reproductive and developmental data for Hg0, making their limit ten times as strict, 0.03 µg Hg/ cubic meter air. 9
Richardson (2009) identified the Ngim et al study10 as the most appropriate for developing an REL, since it presented both male and female dentists in Singapore, chronically exposed to low levels of mercury vapor without the presence of chlorine gas (see below). He used a UF of 10 rather than 3 for the LOAEL, arguing that infants and children are much more sensitive than a factor of 3 can account for. Applying a UF of 10 for human variability, for a total UF of 100, he recommended that Health Canada set their REL for chronic mercury vapor at 0.06 µg Hg/ cubic meter air.11
Lettmeier et al (2010) found highly statistically significant objective (ataxia of gate) and subjective (sadness) effects in small scale gold miners in Africa, who use mercury to separate gold from crushed ore, at even lower exposure levels, 3 µg Hg/ cubic meter air. Following the US EPA, they applied a UF range of 30-50, and suggested an REL between 0.1 and 0.07 µg Hg/ cubic meter air.12
———————————————————————————————————————————————————————-

Table 2. Published RELs for exposure to low level, chronic Hg0 vapor in the general population, without occupational exposure. *Conversion to absorbed dose, µg Hg/kg-day, from Richardson (2011).
———————————————————————————————————————————————————————–
Problems with RELs
The US EPA last revised their mercury vapor REL (0.3 µg Hg/ cubic meter air) in 1995, and although they reaffirmed it in 2007, they acknowledge that newer papers have been published that could convince them to revise the REL downward. The older papers of Fawer et al (1983) 13 and Piikivi, et al (1989 a, b, c)14, 15, 16, depended in great part on measurements of mercury exposure and CNS effects in chloralkali workers. Chloralkali is a nineteenth century chemical industry process in which salt brine is floated over a thin layer of liquid mercury, and hydrolyzed with electrical current to produce sodium hypochlorite, sodium hydroxide, sodium chlorate, chlorine gas, and other products. The mercury acts as one of the electrodes. Workers in such plants are exposed not only to mercury in the air, but chlorine gas as well.
Concomitant exposure of mercury vapor and chlorine gas changes the dynamics of human exposure. The Hg˚ is partially oxidized by chlorine in the air to Hg2+, or HgCl2, which reduces its permeability in the lungs, and dramatically alters its distribution in the body. In particular, HgCl2 absorbed from air through the lungs does not get into cells, or through the blood-brain barrier, as easily as Hg˚. For example, Suzuki et al (1976)17 showed that workers exposed to Hg˚ alone had a ratio of Hg in red blood cells to plasma of 1.5 -2.0 to 1, while chloralkali workers exposed to both mercury and chlorine had a ratio of Hg in RBCs to plasma of 0.02 to 1, roughly a hundred times less inside the cells. This phenomenon would cause the mercury to partition far more to the kidneys than the brain. The exposure indicator, urine mercury, would be the same for both types of workers, but the chloralkali workers would have much less CNS effect. By examining mostly chloralkali worker subjects, the sensitivity of the CNS to mercury exposure would be underestimated, and RELs based on these studies would be overestimated.
Among the newer papers is the work of Echeverria, et al, (2006)18 who finds significant neurobehavioral and neuropsychological effects in dentists and staff, well below the 25 µg Hg/ cubic meter air level, using well established standardized tests. Again, no threshold was detected.
Applying Mercury RELs to Dental Amalgam
There is disparity in the literature concerning dosage of mercury exposure from amalgam, but there is broad consensus on some of the numbers involved, summarized in Table 3. It helps to keep these basic figures in mind, as all the authors use them in their calculations. It also helps to keep in mind the fact that these exposure data are only analogs of exposure to the brain. There is animal data and post-mortem human data, but none on the actual movement of mercury into the brains of the workers involved in these studies.
————————————————————————————————————————————————————————

Table 3. references:
- a- Mackert and Berglund (1997)
- b- Skare and Engkvist (1994)
- c- reviewed in Richardson (2011)
- d- Roels, et al (1987)
———————————————————————————————————————————————————————–
The mid 1990’s saw the publication of two divergent assessments of amalgam exposure and safety. The one that has had the most influence on discussions within the dental community was authored by H. Rodway Mackert and Anders Berglund (1997)19, dental professors at the Medical College of Georgia, and Umea University in Sweden, respectively. This is the paper in which the claim is made that it would take up to 450 surfaces of amalgam to approach a toxic dose. These authors cited papers that tended to discount the effect of chlorine on absorption of atmospheric mercury, and they used the occupational exposure limit, (derived for adult males exposed eight hours per day, five days per week), of 25 µg-Hg/cubic meter air as their de-facto REL. They did not consider the uncertainty in that number as it would apply to the whole population, including children, who would be exposed 24 hours, seven days a week.
The calculation goes as follows: the lowest observed effect level for intentional tremor among adult male workers, primarily chloralkali workers, was 25 µg-Hg/cubic meter air equating to a urine level of about 30 µg-Hg/ gr-creatinine. Accounting for a small level of baseline urine mercury found in people without fillings, and dividing the 30 µg by the per-surface contribution to urine mercury, 0.06 µg-Hg/ gr-creatinine, the result is about 450 surfaces needed to reach that level.
Meanwhile, G. Mark Richardson, a risk assessment specialist employed by Health Canada, and Margaret Allan, a consulting engineer, both having no prior familiarity with dentistry, were tasked by that agency to perform a risk assessment for amalgam in 1995. They came to a very different conclusion than Mackert and Berglund. Using exposure-effect data and uncertainty factors in line with those discussed above, they proposed for Canada an REL for mercury vapor of 0.014 µg Hg/kg-day. Assuming 2.5 surfaces per filling, they calculated a range for the number of fillings that would not exceed that level of exposure for five different age groups, based upon body weight: toddlers, 0-1; children, 0-1; teens, 1-3; adults, 2-4; seniors, 2-4. Based on these numbers, Health Canada issued a series of recommendations for restricting amalgam use, which have been widely ignored in practice.20, 21
In 2009, the US Food and Drug Administration, under pressure from a citizens’ lawsuit, completed its classification of pre-capsulated dental amalgam, a process originally mandated by Congress in 1976.22 They classified amalgam as a Class II device with certain labeling controls, meaning that they found it safe for unrestricted use for everybody. The labeling controls were meant to remind dentists that they would be handling a device that contains mercury, but there was no mandate to pass that information on to patients.
The FDA classification document was a detailed 120 page paper whose arguments depended largely on risk assessment, comparing amalgam mercury exposure to the EPA’s 0.3 µg-Hg/cubic meter air standard. However, the FDA analysis employed only the mean of the US population exposure to amalgam, not the full range, and, remarkably, did not correct for dose per body weight. It treated children as if they were adults. These points were forcefully contested in several “petitions to reconsider” submitted by both citizens’ and professional groups to the FDA after publication of the classification. The petitions were considered cogent enough by FDA officials that the agency took the rare step of convening an expert panel to reconsider the facts of its risk assessment.
Richardson, now an independent consultant, was asked by several of the petitioners to update his original risk assessment. The new analysis, using detailed data on the number of filled teeth in the US population, was the center of discussion at the FDA’s December, 2010 expert panel conference. (See Richardson et al 20115).
Data on the number of filled teeth in the American population came from the National Health and Nutrition Examination Survey, a nationwide survey of about 12,000 people age 24 months and up, last completed in 2001-2004 by the National Center for Health Statistics, a division of the Centers for Disease Control and Prevention. It is a statistically valid survey representing the entire US population.
The survey collected data on the number of filled tooth surfaces, but not on the filling material. To correct for this deficiency Richardson’s group posited three scenarios, all suggested by extant literature: 1) all filled surfaces were amalgam; 2) 50% of filled surfaces were amalgam; 3) 30% of subjects had no amalgam, and 50% of the rest were amalgam. Under scenario 3, which assumes the least number of amalgam fillings, the calculated means of actual daily mercury dosage were:
Toddlers 0.06 µg-Hg/kg-day
Children 0.04
Adolescents 0.04
Adults 0.06
Seniors 0.07
All of these daily absorbed dose levels meet or exceed the daily absorbed dose of Hg0 associated with published RELs, as seen in Table 2.
The number of amalgam surfaces that would not exceed the US EPA’s REL of 0.048 µg-Hg/kg-day was calculated, for toddlers, children and young teens to be 6 surfaces. For older teens, adults and seniors, it is 8 surfaces. To not exceed the California EPA’s REL, those numbers would be 0.6 and 0.8 surfaces.
However, these average exposures do not tell the whole story, and do not indicate how many people exceed a “safe” dose. Examining the entire range of numbers of filled teeth in the population, Richardson calculated that there would currently be 67 million Americans whose amalgam mercury exposure exceeds the REL enforced by the US EPA. If the stricter California REL were applied, that number would be 122 million. This contrasts with the FDA’s 2009 analysis, which considers only the mean number of filled teeth, thus allowing the population exposure to just fit under the current EPA REL.
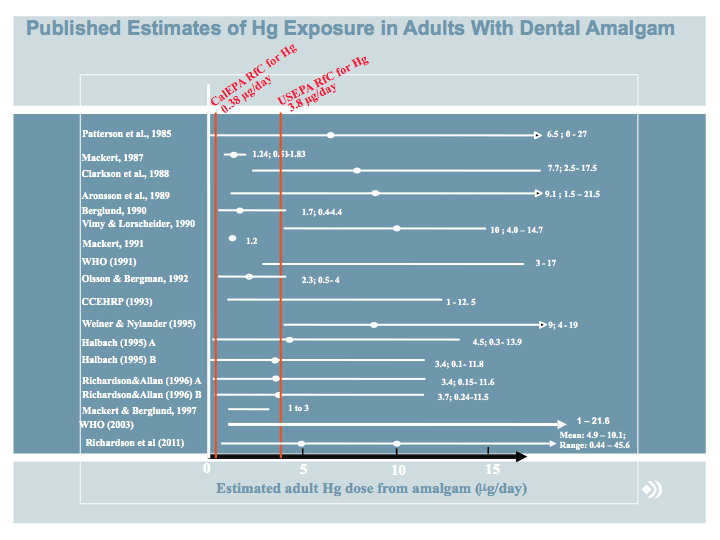
For amplification of this point, Richardson (2003) identified seventeen papers in the literature that presented estimates of the dosage range of mercury exposure from amalgam fillings. 23 Figure 3 depicts them, plus data from his 2011 paper, representing in graphic form the weight of evidence. The vertical red lines mark the dose equivalents of the California EPA’s REL, the strictest of the published regulatory limits for mercury vapor exposure, and the US EPA’s REL, the most lenient. It is evident that most investigators whose papers are represented in Figure 3 would conclude that unrestricted use of amalgam would result in overexposure to mercury.
The Future of Dental Amalgam
As of this writing, June, 2012, the FDA has still not announced a conclusion to its deliberations on the regulatory status of dental amalgam. It is hard to see how the agency will be able to give amalgam a green light for unrestricted use. It is clear that unrestricted use can expose people to mercury in excess of the EPA’s REL, the same limit that the coal fired power industry is being forced to comply with, and to spend billions of dollars to do it. The EPA estimates that as of 2016, lowering emissions of mercury, along with soot and acid gases, would save $59 billion to $140 billion in annual health costs, preventing 17,000 premature deaths a year, along with illnesses and lost workdays.
Moreover, the contrast between the Mackert and Berglund approach to amalgam safety and the Richardson approach highlights the polarization that has characterized the historic “amalgam wars.” Either we say “it can’t hurt anyone,” or “it’s bound to hurt someone.” In this age of good resin-based restorative dentistry, when increasing numbers of dentists are practicing entirely without amalgam, we have an easy opportunity to live by the precautionary principle. The time is right to consign dental amalgam to its honored place in dental history, and let it go. We must go forward with its dénouement – to develop methods to protect patients and dental staff from excess exposure when fillings are removed; protect staff from high momentary exposures, such as occurs when emptying particulate traps.
Dental mercury may be only a small part of the global problem of mercury pollution, but it is the part for which we dentists are directly responsible. We must continue our environmental protection efforts, to isolate mercury laden wastewater from the sewage stream, even as we discontinue its use for concerns of human health.
Stephen M. Koral, DMD, FIAOMT
_________
For more complete details on this subject, see “Amalgam Risk Assessments 2010” and “Amalgam Risk Assessments 2005.”
In its final form, this article was published in the February, 2013 edition of the “Compendium of Continuing Education in Dentistry.”
Additional discussion on risk assessment in relation to dental amalgam can also be read in the “IAOMT Position Paper against Dental Amalgam.”
References
1 Masi, JV. Corrosion of Restorative Materials: The Problem and the Promise. Symposium: Status Quo and Perspectives of Amalgam and Other Dental Materials, April 29-May 1, (1994).
2 Haley BE 2007. The relationship of the toxic effects of mercury to exacerbation of the medical condition classified as Alzheimer’s disease. Medical Veritas, 4:1510–1524.
3 Chew CL, Soh G, Lee AS, Yeoh TS. 1991. Long-term dissolution of mercury from a non-mercury-releasing amalgam. Clin Prev Dent, 13(3): 5-7.
4 Gross, M.J., Harrison, J.A 1989. Some electrochemical features of the in vivo corrosion of dental amalgams. J. Appl. Electrochem., 19: 301-310.
5 Richardson GM, R Wilson, D Allard, C Purtill, S Douma and J Gravière. 2011. Mercury exposure and risks from dental amalgam in the US population, post-2000. Science of the Total Environment, 409: 4257-4268.
6 Hahn LJ, Kloiber R, Vimy MJ, Takahashi Y, Lorscheider FL. 1989. Dental “silver” tooth fillings: a source of mercury exposure revealed by whole-body image scan and tissue analysis. FASEB J, 3(14): 2641-6.
7 Hahn LJ, Kloiber R, Leininger RW, Vimy MJ, Lorscheider FL. 1990. Whole-body imaging of the distribution of mercury released from dental fillings into monkey tissues. FASEB J, 4(14): 3256-60.
8 USEPA (United States Environmental Protection Agency). 1995. Mercury, elemental (CASRN 7439-97-6). Integrated Risk Information System. Last updated June 1, 1995. On-line at: http://www.epa.gov/ncea/iris/subst/0370.htm
9 CalEPA (California Environmental Protection Agency). 2008. Mercury, Inorganic – Chronic Reference Exposure Level and Chronic Toxicity Summary. Office of Environmental Health Hazard Assessment, California EPA. Dated December 2008. Summary on line at: http://www.oehha.ca.gov/air/allrels.html; Details available at: http://www.oehha.ca.gov/air/hot_spots/2008/AppendixD1_final.pdf#page=2
10 Ngim, C-H., Foo, S.C., Boey, K.W. et al. 1992. Chronic neurobehavioral effects of elemental mercury in dentists. Br. J. Ind. Med., 49(11): 782-790
11 Richardson, GM, R Brecher, H Scobie, J Hamblen, K Phillips, J Samuelian and C Smith. 2009. Mercury vapour (Hg0): Continuing toxicological uncertainties, and establishing a Canadian reference exposure level. Regulatory Toxicology and Pharmacology, 53: 32-38
12 Lettmeier B, Boese-O’Reilly S, Drasch G. 2010. Proposal for a revised reference concentration (RfC) for mercury vapour in adults. Sci Total Environ, 408: 3530-3535
13 Fawer, R.F., de Ribaupeirre, Y., Buillemin, M.P. et al. 1983. Measurement of hand tremor induced by industrial exposure to metallic mercury. Br. J. Ind. Med., 40: 204-208
14 Piikivi, L., 1989a. Cardiovascular reflexes and low long-term exposure to mercury vapor. Int. Arch. Occup. Environ. Health 61, 391–395.
15 Piikivi, L., Hanninen, H., 1989b. Subjective symptoms and psychological performance of chlorine-alkali workers. Scand. J. Work Environ. Health 15, 69–74.
16 Piikivi, L., Tolonen, U., 1989c. EEG findings in chlor-alkali workers subjected to low long term exposure to mercury vapor. Br. J. Ind. Med. 46, 370–375.
17 Suzuki, T., Shishido, S., Ishihara, N., 1976. Interaction of inorganic to organic mercury in their metabolism in the human body. Int. Arch. Occup. Environ.Health 38, 103–113.
18 Echeverria, D., Woods, J.S., Heyer, N.J., Rohlman, D., Farin, F.M., Li, T., Garabedian, C.E., 2006. The association between a genetic polymorphism of coproporphyrinogen oxidase, dental mercury exposure and neurobehavioral response in humans. Neurotoxicol. Teratol. 28, 39–48.
19 Mackert JR Jr. and Berglund A. 1997. Mercury exposure from dental amalgam fillings: absorbed dose and the potential for adverse health effects. Crit Rev Oral Biol Med 8(4):410-36
20 Richardson, G.M. 1995. Assessment of mercury exposure and risks from dental amalgam. Prepared on behalf of the Bureau of Medical Devices, Health Protection Branch, Health Canada. 109p. Dated August 18, 1995. On line at: http://dsp-psd.communication.gc.ca/Collection/H46-1-36-1995E.pdf or http://publications.gc.ca/collections/Collection/H46-1-36-1995E.pdf
21 Richardson, GM and M. Allan. 1996. A Monte Carlo Assessment of Mercury Exposure and Risks from Dental Amalgam. Human and Ecological Risk Assessment, 2(4):709-761.
22 US FDA. 2009. Final Rule For Dental Amalgam. On line at: http://www.fda.gov/MedicalDevices/ProductsandMedicalProcedures/DentalProducts/DentalAmalgam/ucm171115.htm.
23 Expanded from: Richardson, GM 2003. Inhalation of mercury-contaminated particulate matter by dentists: an overlooked occupational risk. Human and Ecological Risk Assessment, 9(6): 1519 – 1531. Figure provided by the author via personal communication.
24 Roels, H., Abdeladim, S., Ceulemans, E. et al. 1987. Relationships between the concentrations of mercury in air and in blood or urine of workers exposed to mercury vapor. Ann. Occup. Hyg.,31(2): 135-145.
25 Skare I, Engqvist A. Human exposure to mercury and silver released from dental amalgam restorations. Arch Environ Health 1994;49(5):384–94.

Reactions to and side effects of dental amalgam mercury fillings are based on a number of individualized risk factors.
Dental amalgam mercury fillings continuously release vapor and can produce an array of mercury poisoning symptoms.

This detailed 26-page review from the IAOMT includes research about risks to human health and environment from mercury in dental amalgam fillings.
